Staff-related costs on the rise
Penny Elliott Anderson, Senior Editor
Payroll taxes increased for dentists in all types of practices, according to results of Dental Economics` 1996 Practice Survey. Payroll taxes as a percentage of gross production income increased from:
- 3.2 percent in 1994 to 3.4 percent in 1995 for solo practitioners.
- 3.8 percent to 4.1 percent for space-sharing solos.
- 4.4 percent to 5.1 percent for group practices.
- 3.7 percent to 4.3 percent for partnership practices.
Overall, 1996 survey practice overhead added up to 60 percent of gross for all five forms of practice. The 1995 survey, by comparison, produced the following statistics for overhead:
- 62 percent of gross for employee/contractor-associate practices.
- 60 percent of gross for solo, space-sharing solo, and group practices.
- 59 percent of gross for partnerships.
Salaries
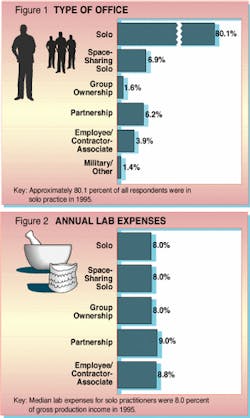
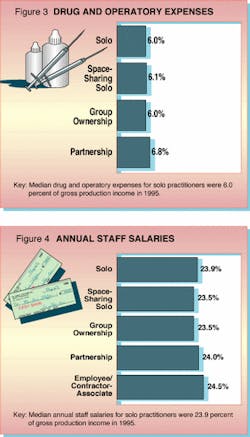
Staff-salary costs increased the most for solo practitioners (who represented 80.2 percent of the survey participants). Salaries as a percentage of gross rose from 23.1 percent of gross to 23.9 percent of gross.
In the other forms of practice, partnerships saw staff costs rise from 23.5 percent in 1994 to 24 percent in 1995 and employee/contractor-associates said salary costs rose from 24 percent to 24.5 percent.
Group practices, on the other hand, showed a decrease in salaries as a percentage of gross, going from 26 percent in 1994 to 23.5 percent in 1995. Space-sharing solos also saw salary costs decline from 25 percent of gross to 23.5 percent of gross.
The accompanying charts display year-to-date figures in comparison with previous survey statistics.
Operatory, Lab Costs
Drug and operatory expenses were up for partnerships, but the same or down slightly for other forms of practice. For partnerships, drug and operatory costs represented 6.8 percent of gross, up from 6 percent the previous year.
Solos saw their costs go down from 6.1 percent to 6 percent and space-sharing solos registered a decline of 0.7 percent, going from 6.8 percent in 1994 to 6.1 percent in 1995. Group practice drug and operatory expenses remained the same at 6 percent of gross.
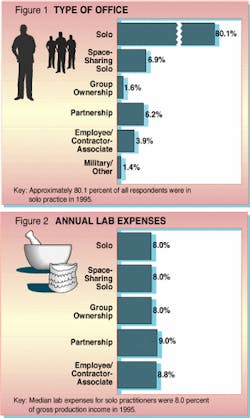
Lab expenses for space-sharing solos went from 8.7 percent of gross in 1994 to 8 percent of gross in 1995. For groups, these expenses declined from 9.5 percent to 8 percent. Partnerships saw an increase from 8 percent to 9 percent. Employee/contractor-associates said lab costs increased from 8 percent to 8.8 percent. Solo lab costs were unchanged at 8 percent of gross.
Telephone, Rent, Mortgage
Laundry and cleaning costs were up slightly for group practices, rising from 0.7 percent of gross in 1994 to 1 percent of gross in 1995. But these costs remained the same for partnership and solo practices at 1 percent of gross, decreasing marginally for space-sharing solos from 1 percent to 0.9 percent.
Median phone and utility expenses remained stable at 1.7 percent and 1.5 percent, respectively, for space-sharing solo and partnership practices. A decrease was noted for solo practices - 2.0 percent in 1994 to 1.9 percent in 1995. Group practice phone and utility expenses increased from 1.4 percent of gross in 1994 to 2 percent of gross in 1995.
Annual rent or mortgage payments increased from 5 percent of gross in 1994 to 6 percent of gross in 1995 for group practices. Median costs in this area were down 1 percent for partnership practices, declining from 5 percent in 1994 to 4.1 percent in 1995. Solo and space-sharing solo rent or mortgage payments remained the same at 5 percent of gross.
The Dental Economics survey also revealed that 23.1 percent of 1996 survey respondents have equipment-leasing payments, down from 24 percent in our 1995 survey. Of those who do, the median expenditure, as a percentage of gross, by type of practice, is:
- Solo and space-sharing solo, 3 percent, up from 2.5 percent the previous year.
- Partnership, 2.2 percent, up from 2 percent in our 1995 survey.
- Group, 3.5 percent, up dramatically from 1 percent of gross the previous year.
Bookkeeping, Marketing
The median bookkeeping expense is:
- 1.2 percent of gross for solo practitioners.
- 1 percent for space-sharing solo, partnership and group practices.
Median expenditure for advertising for group practices declined from $5,250 in our 1995 survey to $5,000 in our 1996 survey. But group practices still spend more than double than any other form of practice.
Median advertising expenditure for the other practice types is:
- $1,800 for solos, up from $1,500 the previous year.
- $655 for space-sharing solos, a sharp decline from $1,000 the previous year.
- $2,200 for partnerships, down from $2,279 in our 1995 survey.
Expenses for promotional activities registered a median of $1,000 for solos (identical to last year`s results); $800 for space-sharers, down from $1,000 the previous year; $1,200 for partnerships, down from $1,600 in our 1995 survey; and $1,200 for groups, up from $1,100 in last year.
Dues, CE Expenses
Examining dues and continuing-education expenses, Dental Economics found the medians to be:
- $2,500 for solos, up from $2,200 in our 1995 survey.
- $1,575 for space-sharing solos, down from $2,500 the previous year.
- $3,000 for partnerships, up from $2,500.
- $2,000 for group practitioners, half the $4,000 spent for dues and continuing-education last year.
We also crosstabbed this question by geographic region and found that New England and Pacific Region dentists - at $3,000 - had the highest median expenditures for dues and continuing education.
The median expenses for dentists in the seven other regions were:
- Middle Atlantic, $2,000.
- East North Central, $2,226.50.
- West North Central, $2,799.50.
- East South Central, $2,250.
- West South Central, $2,500.
- Mountain, $2,261.
For the past two years, the Mountain Region had the highest median expenditure in this category.
As you review the information on the charts, keep in mind that although the survey was conducted in 1996, the data is for 1995.


