Dental workforce trends and the future of dental practices
"Dentist" is defined broadly in this article to include: those who work in private practice (either full- or part-time); dental school/faculty staff members; those who are state or local government employees; hospital staff dentists; dental graduate students, interns, or residents; dentists in the armed forces or those who provide other federal services (e.g., Veterans' Affairs or Public Health Service); and other health or dental organization staff members.
The first article in this series explored trends in dental education. The article identified major shifts in the dental school applicant pool, factors that have influenced the number of applicants to dental school, and how applicant levels, in turn, influenced dental school enrollment. Some important findings include: the current surge in dental and dental hygiene graduates, the recent growth in the number of dental schools, and the expanding level of indebtedness upon graduation. This article continues the series by exploring the impact of these enrollment trends on dental workforce levels.
Dental workforce trends
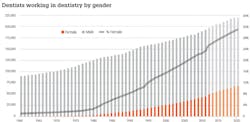
Since 1960, the number of dentists in the United States has increased from just over 90,000 to just fewer than 205,000 as of 2014, an increase of 127% (Fig. 1). Over this time period, the annual increases have been fairly consistent. The 1970s were the period of greatest growth with the number of dentists increasing by 21%, while the 1980s had the slowest growth at only 12%. The total number of dentists in the United States should continue to increase to just fewer than 220,000 by the year 2020. Two factors are contributing to the rise in the number of dentists: an increasing number of dental school graduates and an increase in the average age of retirement for dentists. As noted in the first article in this series, dental school graduates are on the increase and could approach 6,000 by the end of the decade. In addition, dentists have been delaying their retirement. In 2001, the average age of retirement was 64.8. By 2013, the average retirement age had risen to 68.7.
Gender and work status
Figure 1 also shows the percent of female dentists. Prior to the 1980s, female dentists were a small segment of the dental workforce; less than 3% of all dentists in 1980 were female. With women currently representing an estimated 27% of the dental workforce, the rapid growth in female participation over the past few decades is obvious. Dental enrollment trends indicate that female participation in the dental workforce should increase to approximately 31% by 2020. In academic year 2012-2013, 47.9% of the students enrolled in dental school were women. Their representation in dental schools across the United States has continued to rise slowly. It will likely take a generation for women to achieve parity in the dental workforce.

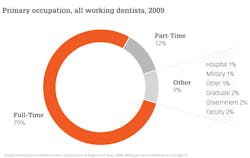
The vast majority of dentists are in private practice, but not all dentists work full time. Full-time dentists are defined as working at least 30 hours per week. Historical data indicates that almost all dentists used to work full time. In 1975, less than 10% of all working dentists worked part time. The number of dentists working part time has increased over the past 40 years. Currently, an estimated 14% of all active dentists who are in private practice and 12% of all dentists work part time (Fig. 2). The trend in the proportion of part-time practitioners has been stable for the past decade. In addition, there were 16,496 active dentists who were not in private practice in 2009. They included faculty (3,914), government employees (3,767), graduate dental students (3,281), military (2,219), hospital dentists (899), and active dentists who did not fit into any of these categories (2,416).
Recent data suggest a relationship between gender and work status. In 2009, female dentists were twice as likely to work part time as their male counterparts (16.1% vs. 8.0%). Female dentists were also twice as likely to work in government service, hospitals, and as members of health or dental organization staff. Female dentists who had graduated within the last 10 years were almost three times as likely to work part time (14.0% vs. 5.1%). These recent female graduates were also twice as likely to be on the staff of a dental school or hospital. It remains to be seen whether gender differences in work patterns persist as the number of female dentists approach parity in the workplace. If gender differences in work status persist, it would have an impact on the proportion of dentists in the workforce who work a full-time schedule and participate in private practice.
Compensation and corporate dentistry
The compensation method for dentists has changed significantly over time. In 1950, only 0.5% of all dentists were employed by another dentist.1 Data from 2007 to 2009 indicate that almost 17% (16.9%) of all active private practitioners were employees.2 Among new active private practitioners, 44% were employees. This trend in how dentists are compensated raises the issue of corporate dentistry.
Much discussion of the growth of corporate dentistry has taken place, but comprehensive data on this type of practice organization does not exist. The Association of Dental Support Organizations (ADSO) was formed in 2008 and represents many of the larger corporate dental entities. Their members represent more than 35,000 employees - including more than 8,000 dentists, 4,000 dental hygienists, and more than 24,000 dental operatories.3 While the information from the ADSO gives us some notion of the current scope of the corporate dental sector, it does not include all of the corporate dental entities.
Clearly, a viable classification of practice organization needs to be developed and rigorous data collection should be initiated. The classification scheme should be centered on practice ownership status and on how the dentist is compensated. The corporate dental model has the potential to have a major impact on the cost and distribution of dental services. Prominent national dental organizations, such as the American Dental Association, should be involved in this data collection effort. Without accurate information on the extent and distribution of corporate dental practices, our efforts to monitor changes in the dental profession will be severely hampered.
Specialization
Growth in the proportion of dentists who are dental specialists has occurred over the past half century. In 1970, less than 10% of all active dentists were specialists. Currently, about 22.5% of dentists are specialists. This proportion should remain fairly stable until the year 2020. While the number of dental school graduates has been increasing, the number of specialty graduates has been relatively stable for the past 40 years, with the exception of pediatric dentistry. In 1971, there were 163 first-year graduate pediatric dentistry students. By 2012, there were 405 first-year students, an increase of almost 150%. Due to this exceptional growth, it is likely that pediatric dentists will be the second largest group of practicing dental specialists by 2020, trailing only orthodontists. Should the number of dental graduates continue to grow over the remainder of the decade, it is likely that the number of dental specialty graduates will grow in roughly the same proportion.
The dentist-to-population ratio
The number of dentists in relation to the population can vary significantly over time. Historically, the number of dentists in this ratio goes through periods of increase and periods of stability. The 1960s were a period of stability with the number of dentists in the ratio increasing by less than 1% over the course of the decade. The 1970s and 1980s were periods of growth with the ratio increasing by 10.3% and 5.5% respectively. However, the 1990s saw the ratio fall slightly, and there was only modest growth in the first decade of the 21st century (2.8%). With the growing number of dental school graduates, increases in the dentist-to-population ratio should be brisk this decade, around 8%.
Demographics
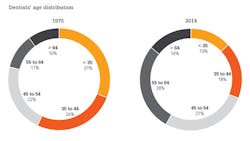
The demographic profile of dentists has changed significantly over time as well. In 1975, dentists were generally young and male (Fig. 3). Fifty-seven percent of all dentists were younger than 45 years old, and almost all of them (98%) were male. The past 40 years have seen a lot of change. In general, the dentist population is now older, and there is a much larger representation of females. Today, 42% of dentists are at least 55 years old, and only 31% are younger than 45 years old. The differences are even greater when gender is considered. More than half of the male dentists (52%) are at least 55 years old. 56.2% of female dentists, on the other hand, are younger than 45 years old.
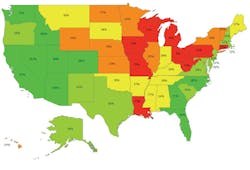
There have also been significant shifts in the geographic location of dentists over the past 25 years (Fig. 4). Although all states have had at least some increase in the number of dentists, these increases vary greatly by region and individual state. Regions that have experienced the greatest growth rates are the Atlantic Coast, the Southwest, and the West. There is a variety of reasons for these shifts. Some of the major factors accounting for these shifts are population shifts, perceived economic opportunities, and lifestyle considerations.
Obviously, significant changes in the dental workforce are underway. These changes will certainly have an impact on dental economic trends and the practice of dentistry. In the next article in this series, we will explore dental economic trends and see how the changes in the dental workforce might influence the economic trends of the future.
IN THIS SERIES:
PART ONE | The future of dental practice — dental education
PART THREE | The future of dentistry: Dental economics
References
1. Survey of the dental profession. Chicago, IL: American Dental Association (1950): 14.
2. Distribution of dentists in the United States by region and state. Chicago, IL: American Dental Association (2009): 52.
3. Dufurrena Q. Future practice models for dentistry: The future of dental support organizations. Association of Dental Support Organizations (2014).
Eric S. Solomon, DDS, MA, is a professor of public health sciences at Texas A&M University, Baylor College of Dentistry. He earned his bachelor's degree, master's degree, and dental degree from the University of Maryland. He also completed a general dentistry residency from the University of Rochester, a certificate in conflict resolution from the Texas A&M University System, and a graduate certificate in geographic information systems from the University of Texas at Dallas. He has published more than 130 articles in scholarly journals and has frequently been invited to speak on a wide variety of topics related to dental education and the future of dentistry.