The future of dentistry: Dental economics


The first two articles in this series explored trends in dental education and how these trends have impacted the distribution of the dental workforce. We saw how significant shifts in dental school enrollments eventually translated to changes in the number and distribution of dentists. Some of the major changes in the dental workforce included: an increase in the number of dentists and increased proportions of female dentists, part-time dentists, and specialty-trained dentists. Finally, we saw a dentist-to-population ratio that is currently increasing and projected to increase at least until the year 2020. In this article, we will explore trends in dental economics.
PART ONE | The future of dental practice: Dental education
Dental Economic Trends
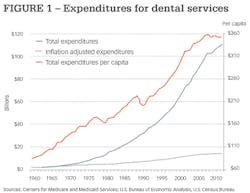
For the past half-century, expenditures for dental services increased from just under $2.0 billion in 1960 to almost $111 billion in 2012 -more than a 50-fold increase (Figure 1). Until the past few years, these increases were driven by an increasing proportion of the population seeking dental care and increases in the cost of dental services. Historically, these increases in dental expenditures persisted through periods of economic prosperity and decline. Since the recession of 2007, the increases in dental expenditures have been modest - only 2.8% per year.
The U.S. Centers for Medicare and Medicaid Services have projected dental expenditures increasing to $170.0 billion by the year 2020. That's an additional 53% increase in total expenditures for dental services and an average annual increase of 6.7%. Further analysis of the current trend in expenditures reveals this projection to be potentially overly optimistic. To examine the trend in dental expenditures in greater detail, these data were adjusted for changes in the rate of inflation using the Consumer Price Index. The expenditure data were also divided by the total population of the U.S. to arrive at expenditures per capita for dental services. Even when adjusted for inflation, dental expenditures generally rose annually. However, since 2007, inflation-adjusted expenditures have increased by only 2.9% or 0.6% annually.
Expenditures per capita for dental services increased from $10.86 in 1960 to a peak of $358.00 in 2008-a more than fourfold increase or an average annual increase of 8.7% per year. The trend in expenditures per capita does a better job of highlighting periods of economic decline. You can clearly see the dip in expenditures per capita during the recessions of the late 1970s, the early 1990s, at the turn of the century, and the most recent recession. As noted above, per capita expenditures have only increased by 0.6% or 0.1% per year since 2007. Clearly, there are signs that the growth in spending for dental services is slowing and may even be stagnant. However, the recovery from the last recession has been slow and uneven and may be continuing to have an effect on the demand for dental services. Other factors may also be at work here. We will explore them in the final article of this series, which will be on dental practice.
PART TWO | Dental workforce trends and the future of dental practices
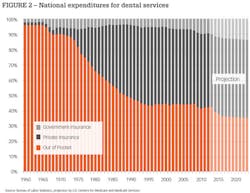
The mix of expenditures' sources for dental services has also undergone major shifts (Figure 2). In 1960, out-of-pocket expenditures accounted for over 97% of dental expenditures. Insurance as a source of dental expenditures increased rapidly through the decades of the 1970s, 1980s, and early 1990s, peaking at 51.8% of dental expenditures in 1996. Since then, private insurance as a source of expenditures has decreased slowly. Government sources of dental expenditures were virtually nonexistent in 1960, accounting for less than 1% of all expenditures. Government expenditures have risen slowly since then. The profile of expenditures for dental services in 2012 was 48.1% from private insurance, 42.3% from out-of-pocket, and 9.6% from government sources. In contrast, all government sources accounted for 55.4% of expenditures for physician and clinical services in 2012.
The U.S. Centers for Medicare and Medicaid Services predicts insurance as a source of dental expenditures will remain relatively stable at 51.0% up to 2023. They also estimate out-of pocket expenditures will decline to 35.1% and government sources will increase to 13.9% of all dental expenditures by 2023. This projection estimates government expenditures for dental services more than doubling by 2023 to $26.7 billion. Historically, government expenditures for dental services have not increased at this rate.
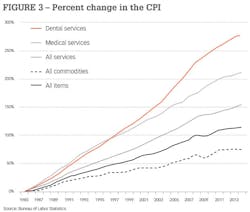
The cost of goods and services is influenced by inflationary factors. Figure 3 shows the overall inflation rate and how inflation has affected the overall cost of goods, services, medical services, and dental services over the past 30 years. This graph shows how much goods and services in 1984 have increased up to 2014. For example, the overall rate of inflation has increased by approximately 114% over the past three decades. Therefore, the overall cost of all goods and services has approximately doubled over this time period. The cost of services has risen at about twice the rate of durable goods over this time period (154% versus 76%). The ability to import goods at a relatively low cost has probably had a major role in this trend.
As one might expect, the cost of medical services has risen more than twice as rapidly as the overall rate of increase (212%). Unfortunately, the cost of dental services has risen even more steeply. Since 1985, there has been a 279% increase in the cost of dental services. There are several reasons for the increased cost of dental services, including increased requirements for infection control protocols and increasing staffing levels. We will investigate the staffing level issue in more detail in the final installment of this series.
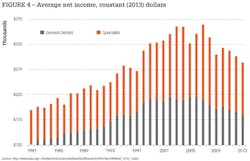
Dental incomes generally follow the trend in dental expenditures. The average total net income for general dentists and dental specialists is shown in constant 2013 dollars (Figure 4). Since these data are adjusted to 2013 dollars, the incomes shown here are more easily compared to current income levels. Since 1981, real income for general dentists has increased by just over 50%, from about $120,000 to $180,950 in 2013. However, virtually all this increase occurred up to 2005. Since 2005, real income for general dentists has not kept pace with inflation and has fallen by 16.2%. Income for dental specialists follows the same trend, increasing from about $190,000 in 1981 to $359,413 in 2007 (89.1% increase), then falling by 21.0% between 2007 and 2013 to $283,900. If expenditures for dental services remain relatively stagnant, and if the number of practicing dentists continues to grow, increases in real dental incomes is unlikely.
The building blocks are now in place for an analysis of the practice of dentistry and its future. We have viewed the trends in dental education, and how these trends have impacted the dental workforce. This article reviewed some of the major dental economic trends. In the final article in this series we will explore dental practice trends and see how all these factors might change the dental practice of the future.
Eric S. Solomon, DDS, MA, is a professor of public health sciences at Texas A&M University, Baylor College of Dentistry. He earned his bachelor's degree, master's degree, and dental degree from the University of Maryland. He also completed a general dentistry residency from the University of Rochester, a certificate in conflict resolution from the Texas A&M University System, and a graduate certificate in geographic information systems from the University of Texas at Dallas. He has published more than 130 articles in scholarly journals and has frequently been invited to speak on a wide variety of topics related to dental education and the future of dentistry.