Key performance indicators for dental practices: Management by statistics
Mark J. Nadaud, CPA/ABV
Whether it’s owning a large multinational corporation or a private dental office, everyone knows that being a business owner comes with headaches, stress, and anxiety. Owners deal with a plethora of issues, many of which don’t relate to patient care, and every decision gets funneled to the owner of the practice. As many doctors will agree, owners have a lot on their plates and not a lot of time on their hands. This is why a streamlined system to efficiently and effectively handle all areas of the dental practice is a necessity—to save time without compromising the health of the practice. An area that often gets overlooked is the identification, analysis, and implementation of key performance indicators (KPIs).
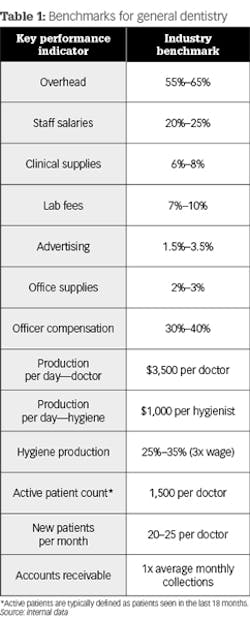
KPIs are unique to every specialty in the dental industry. The idea is to be able to identify, track, and analyze various metrics in order to make more informed and strategic business decisions. Nowadays, profit and loss statements and balance sheets are no longer sufficient to fully comprehend a practice’s health in this highly competitive industry. In addition to monthly or quarterly financial statements, I recommend that an owner obtain supplemental reports to allow him or her to track performance statistics to fully understand where the practice currently is, how it compares to prior periods, and whether it is in line with industry benchmarks (tables 1 and 2).
Doctors don’t have the free time to sift through pages of financial data to identify and interpret the major metrics of their practices. Rather, they are better off with a short report (1–2 pages) that clearly summarizes the main business statistics. The first step to developing these reports is to ensure the information has been entered correctly in the system. Once owners are confident the information is correct, they need to identify the KPIs they find most relevant and determine a streamlined way to analyze the information. It is recommended that a custom report is created in the software that allows the doctor to easily print and send the information to his or her accountants for analysis.
This article will focus on two areas of dentistry and the KPIs that doctors in general practice and orthodontics should be keeping track of.
General dentistry KPIs
Production (gross and net)
Keeping track of production adjustments is important, especially when you are considering adding or dropping an insurance provider. Doctors are experiencing an increase in insurance adjustments that is hurting the profitability of their practices.
Collections
There is often a timing difference between production and collections, but it is still a good idea to track the collections in relation to production and in comparison with prior periods.
Clinical days worked per month
Tracking clinical days worked per month will help establish a system to track production per day. A practice should strive for at least an average daily production of $3,500 per doctor and approximately $1,000 per hygienist.
Production by provider
This allows the doctor to understand the production of associate doctors and/or hygienists in relation to total production of the practice. A bread-and-butter practice with an efficient hygiene staff often has hygiene production around 35% of total production, which can significantly increase the profitability of the practice. On the other hand, if the hygiene department makes up too much of the total production percentage, then the doctor may be giving up some of his or her production, which is more profitable than hygienists’. Keep in mind that a doctor who is trained in specialty procedures will often show lower production from the hygiene department due to the highly profitable specialty procedures.
Production by procedure and total procedures performed
These KPIs allow the doctor to fully understand the procedures that bring in the most production dollars (total and per treatment), so the doctor can focus on certain procedures. Understanding the expenses associated with treatment will further help the analysis by identifying procedures with the highest profit margins.
Accounts receivable
Keeping track of the accounts receivable (AR) balance at the end of each month and the change in the AR balance will illustrate the health of the collection process. If the practice consistently sees an increase month-to-month in the AR balance, this may be the result of a poor collection process, which the doctor should address.
New patients per month
This is the pipeline of any general dentist and will illustrate the strength of the practice’s brand in attracting new patients. Knowing the source of new patients is key, as it will help identify which marketing efforts are most effective. A well-marketed practice should expect to see 20 to 25 new patients per month, per doctor.
Total patients seen per month
This metric will allow the doctor to track production per patient, which should be compared to prior periods. When analyzing this figure, be sure not to double count patients who were seen by both the doctor and a hygienist. In addition to monthly patient visits, it is recommended that doctors keep track of the practice’s active patient count. Many dental advisors say that a 1,500 active patient count (patients who have been seen in the last 18 months) is a healthy number. I tend to agree, even though we see many clients who are capable of having a larger number of active patients.
KPIs for orthodontic practices
Production (gross and net)
Many orthodontists are starting to accept some form of insurance to cover the cost of treatment. Understanding write-offs and other adjustments will help make future insurance decisions easier.
Collection
Doctors should fully understand their collection processes, how much down payment is required, and how long treatments will last. The ideal scenario is to collect a down payment ($800 on average) and then set patients up on a monthly payment plan over the course of treatments.
Patients over the effective treatment time
When a patient exceeds his or her effective treatment time, it means the doctor continues to see the patient when the collections have already been realized. Although doctors have a moral obligation to see a patient through, the extra chair time takes away that same chair time from potential new patients.
Total patient visits and clinical days worked per month
For orthodontists, production per day and per patient are good metrics to review. These should be compared to prior periods to identify trends. A decrease in production per patient visit and patients per clinical day of work can be a sign that the office is slowing down or becoming less efficient.
New-patient exams and starts
This is an important metric and allows the doctor to keep track of new patients, where new patients were sourced (i.e., referral source), and the treatment acceptance rate. The treatment acceptance rate is calculated by taking the number of new-patient starts by the total number of new-patient exams (excluding phase two; see below). We have found a treatment acceptance rate of greater than 70% is a healthy number.
New contracts per month
This metric allows doctors to determine the treatment pipelines of their practices and builds the contracts receivable balance. It is also helpful to isolate the various starts: (1) phase I, (2) phase II, (3) full treatment, and (4) Invisalign. The doctor can then take this a step further and determine the average contract fee per treatment plan and compare it to the average orthodontic fees in the area.
Total contracts receivable at the end of the month
This essentially is the amount of money the owner expects to collect by fulfilling the treatment plans of the current patients. The metric is a good gauge of the strength of the orthodontic practice and its current patient base and should be around 50% of collections (unless the orthodontist collects a large down payment from the patients).
Additional considerations
Once doctors are able to obtain the necessary data to keep track of the various KPIs, they should work with their advisors to develop a monthly or quarterly report that will compare their KPIs to previous periods and allow them to understand the trends of their practices. This KPI report should be consistent every period and serve as supplemental information to the profit and loss statement, which doctors should receive on a monthly or quarterly basis.
In addition to the various key performance indicators mentioned, dentists should understand the normalized overhead to get to the true profitability of the practice. This is often defined as the profit of the practice prior to the doctor’s or owner’s compensation. A simple way to back into a normalized profit is to take the practice’s net income and add back various expense items: interest, depreciation and amortization, owner’s compensation, and discretionary/one-time/nonbusiness-related expenses. If the normalized profit is in line with industry overhead benchmarks, then you are in good shape. If it is not, then it might be time to dive into the numbers to determine where you are off. Table 3 shows some overhead benchmarks for the various dental professions and the common expense items that can get out of line.
Mark J. Nadaud, CPA/ABV, is a partner at KBN Advisors LLP, a CPA and business advisory firm serving the dental industry. Headquartered in Cleveland, Ohio, KBN advises dentists in more than 25 states by working with them in all aspects of their businesses. Feel free to contact Mr. Nadaud at (440) 605-1400 or email him at [email protected].


