Emergency loans to dental organizations during the COVID-19 pandemic
As the COVID-19 pandemic raged on amid an anxious public slowly returning from quarantine, economists provided a simple indicator for the nation’s economic recovery: dentists.1 It was predicted that Americans’ willingness to return to dental offices would signal whether the rest of the economy would gradually return to normal or continue to stagnate as a result of the pandemic.
Dental offices, however, experienced a major shock, limiting their operations throughout the pandemic and beyond. A combination of patient anxiety, federal guidelines, and state-mandated closures severely reduced the revenue for dental providers across the country. Within the first month, the ADA Health Policy Institute (HPI) found that 96.6% of practices were either open only for emergency care (79.4%) or closed entirely (17.2%).2
As health-care restrictions began to ease, many health-care providers were in no position to meet the pent-up demand from extended closures.3 One report indicated that only 27% of dental providers were fully paying their staff, whereas from 28%–49% paid no staff at all.2 So, while patient desire to return to the dental office may be a strong signal for economic confidence, the sustained shock to oral health organizations and their staff required significant policy innovation to weather the sustained damage during the pandemic.
One such policy response was the CARES Act. To reduce the economic effects of mandated closures, federal policy makers included dental providers in the CARES Act Paycheck Protection Program (PPP), which provided emergency loans to businesses.4 Designed to mitigate the economic consequences of closures, revenue loss, and mass unemployment, these emergency loans offered nongovernmental dentist organizations access to low– to no-interest capital, intended for maintaining staff levels necessary to provide dental services upon reopening. Overall, the PPP came with significant scrutiny.5,6
PPP study
I conducted a study to explore the geographic variation of PPP activity for dental organizations. With the dramatic impact on dental providers from both the COVID-19 pandemic and the policy response to the pandemic, the PPP seemed an ideal solution for dental organizations. Yet, geography-skewed PPP activity might suggest disproportionate access to this emergency capital, thus creating an inequity in overcoming the negative consequences both in the short and long term.
This study aimed to identify variations of state-level PPP activity for dental organizations during the first three months of the CARES Act. Comprehensive data from the US Small Business Administration included all PPP recipients.7 Dental organizations were identified by North American Industry Classification System (NAICS) code. Adjusting for the supply of dental organizations, this study analyzed the number of loans, value of loans, and jobs retained for each state and the District of Columbia. See Figure 1.
Number of loans
While only accounting for 1.1% of all registered businesses in the US, dental organizations made up 2.1% of all PPP recipients. Among the 200,394 US dental organizations registered by NAICS, 99,439 received a PPP loan (49.6%). Yet, there is considerable variation by state. While less than 40% of dental organizations received PPP loans in the District of Columbia and Wisconsin, over 70% of all dental organizations received PPP loans in Utah and Idaho. See this online supplement for each state’s activity.
Value of loans
Similar patterns emerge when investigating the value of loans made to dental organizations. California was the only state exceeding $1 billion in PPP funds for dental organizations at $1,150,000,000. This figure nearly doubled the next highest recipient of Texas ($653,303,361). However, after adjusting for the number of dental organizations in each state, California exceeds only three states—New York, Illinois, and Kentucky—and the District of Columbia, with $37,370 in PPP loans per dental organization. The adjusted, state average value of PPP loans is $43,450.
Six states—Maine, Kansas, New Hampshire, South Dakota, North Dakota, and Delaware—exceed $60,000 in PPP funds per dental organization. An additional measure quantifying the value of PPP loans to dental organizations utilizes state expenditure data.8 For all US dental organization recipients, the $43,450 in PPP funds represents 7.7% of annual US dental expenditures. Again, discrepancies persist: the PPP loans for four states—Connecticut, New Mexico, Arizona, and Alaska—account for less than 6.7% of dental expenditures, whereas the PPP loans for five states—Kansas, Maine, Delaware, Nebraska, and Hawaii—account for more than 9.2% of all dental expenditures. Nebraska and Hawaii PPP loans make up 10.1% and 11.3% of dental expenditures, respectively, suggesting a major reliance on the program despite lower dental expenditures prior to the pandemic.
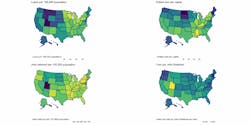
The ultimate goal of the PPP was to maintain staffing levels during the peak of COVID-induced closures. During the first three months of PPP activity, the loan program resulted in 722,459 dental jobs retained. The adjusted measure indicates an average of 3.6 jobs retained for every dental organization. Again, the state-by-state variation indicates a disproportionate benefit from the loan program. District of Columbia reported the lowest number of jobs retained per dental organization (1.8). Five other states reported fewer than three jobs per dental organization: New York, Virginia, Oregon, New Jersey, and Alaska. Conversely, Delaware, Idaho, and South Dakota reported more than five jobs retained per organization. The largest recipient, on a per-organization basis, was Utah, which reported 8.2 jobs retained per dental organization.
Efficiency
While jobs retained may be the ultimate goal, public policies are judged by their effectiveness as well as efficiency. This study measures the efficiency of the emergency loan program with the following calculation: average value of loans divided by the average jobs retained. Rather than controlling for dental supply, this measure controls only for the number of loans received in each state. A smaller number indicates that dental organizations in the state were more efficient with PPP funds by spending less loan money per job retained. Conversely, a higher value indicates that the jobs retained were “more expensive.”
The average “cost” of a job retained at US dental organization was $12,052. In four states—Utah, Arizona, Nevada, and Texas—the cost of a job retained was less than $10,000. Dental organizations in Utah created the most jobs for the least amount of money per loan ($5,420). Following a similar trend, in the District of Columbia, Oregon, Washington, and New Hampshire, the cost per job retained exceeded $16,000.
Conclusions
The Paycheck Protection Program was a popular component of the CARES Act for businesses, but the allocated funds were depleted within the first three months. Organizations that were able to navigate the process and obtain these emergency loans may be better equipped to financially survive and recover from the extended lockdowns. Further, organizations that used the money to retain employment levels may not be required to pay back the low-interest loans at all, but rather will be able to treat the influx of capital as an emergency grant.
This exploratory study, however, shows that the PPP loans were not evenly distributed among dental organizations across the states. Small New England and Midwestern states appeared to have accounted for a disproportionate share of PPP loans to dental organizations, compared to larger, coastal states. Yet, even this simplified review fails to account for outliers such as Wisconsin (lower proportion of dental organizations receiving PPP loans) and the regional variation observed in the Southwest (Utah, Arizona, and Nevada, with considerably different PPP activity).
However, policy makers and advocates should not necessarily use these findings as an implication for misallocating federal funds. Despite being less likely to experience the negative effects of COVID-19 lockdowns or high rates of infections, the disproportionate emergency capital for dental organizations in the smaller states may still have been necessary to maintain operations. Even before the arrival of COVID-19 in the spring of 2020, the plight of rural dental practice and profitability put many rural dental organizations at risk of closure.9
Predicting elevated risk, dental organizations in these smaller states may have envisioned these PPP loans as necessary to continue being able to serve their community. More rigorous analysis of PPP activity and its long-term effects remain warranted as policy makers continue to navigate the complexities facing health-care organizations throughout the pandemic.
References
1. Kliff S. How’s the economy doing? Watch the dentists. The New York Times. June 10, 2020. https://www.nytimes.com/2020/06/10/upshot/dentists-coronavirus-economic-indicator.html
2. ADA Health Policy Institute examines impact of COVID-19 on dentistry. Endodontic Practice US. May 11, 2020. https://endopracticeus.com/industry-news/ada-health-policy-institute-examines-impact-of-covid-19-on-dentistry/
3. Reese P. Dental and doctors’ offices still struggling with COVID job loss. Kaiser Health News. July 28, 2020. https://khn.org/news/dental-and-doctors-offices-still-struggling-with-covid-job-loss/
4. Elenev V, Landvoigt T, Van Nieuwerburgh S. Can the COVID bailouts save the economy? National Bureau of Economic Research. Issued May 2020. http://www.nber.org/papers/w27207
5. Dorning M, Matthews S, Saraiva C. Trump’s rural base fared better than coastal cities in SBA loans. Bloomberg. April 29, 2020. https://www.bloomberg.com/news/articles/2020-04-29/trump-s-rural-base-fared-better-than-coastal-cities-in-sba-loans
6. Granja J, Makridis C, Yannelis C, Zwick E. Did the Paycheck Protection Program hit the target? Social Science Research Network; Report No.: ID 3585258. https://papers.ssrn.com/abstract=3585258
7. Hatch C. SBA and Treasury announce release of PPP loan data. Small Business Administration. July 6, 2020. https://www.sba.gov/about-sba/sba-newsroom/press-releases-media-advisories/sba-and-treasury-announce-release-ppp-loan-data
8. Health care expenditures by service by state of provider (in millions). Kaiser Family Foundation. June 16, 2017. https://www.kff.org/other/state-indicator/health-spending-by-service/
9. Minnesota dental clinics at risk of permanent closure. Dent Today. April 24, 2020. https://www.dentistrytoday.com/news/industrynews/item/6330-minnesota-dental-clinics-at-risk-of-permanent-closure
JASON SEMPRINI, MPP, is a National Institutes of Health (NIH) fellow at the University of Iowa, College of Dentistry. Before beginning his PhD in health services research, Semprini completed his master’s in public policy at the University of Chicago. He has dedicated his professional career to public service, having served four years as an AmeriCorps member in Iowa and two years as a Peace Corps volunteer in Fiji. Send inquiries to [email protected].
About the Author

Jason Semprini, MPP
JASON SEMPRINI, MPP, is a National Institutes of Health (NIH) fellow at the University of Iowa, College of Dentistry. Before beginning his PhD in health services research, Semprini completed his master’s in public policy at the University of Chicago. He has dedicated his professional career to public service, having served four years as an AmeriCorps member in Iowa and two years as a Peace Corps volunteer in Fiji. Send inquiries to [email protected].