Are your fees keeping pace?
Annual survey allows dentists to make regional and national comparisons.
Penny Elliott Anderson, Senior Editor
Fees for 46 dental services increased an average of 5.3 percent in 1995, doubling both the 2.5 percent average-fee increase in 1994 and the 1995 inflation rate. Our fourth, annual Dental Economics Fee Survey showed the highest individual-service increases for infection-control fees, up 16.7 percent; intraoral periapical, each additional film, up 12.5 percent; child fluoride treatment, up 11.8 percent; and gingival curettage, up 11.4 percent.
Although the highest percentage increase for any one service was for infection-control fees (as it was in our previous two surveys), only 6 percent of respondents (the same percentage as in last year`s survey) indicated they charged a separate infection-control fee.
Sixty-five percent of our fee-survey respondents told us they planned an across-the-board fee increase in their practices in 1996. When asked how often they raise fees, 57 percent said annually, 29 percent answered once every two years, 7 percent said once every three years and another 6 percent said about once every three years.
In the past two years, a much lower percentage of urban dentists indicated they would be raising fees than suburban and rural practitioners. But that margin narrowed this year, with 68 percent of suburban, 64 percent of urban and 63 percent of rural dentists saying they anticipated an across-the-board fee increase in 1996.
Survey Demographics
In November 1995, we mailed a questionnaire with a cover letter to a random sample of 2,500 dentists throughout the United States. By the Dec. 20 cut-off date, we received a total of 785 usable, completed questionnaires for a response rate of 31 percent, down from 36 percent the previous year. The sample size assures a margin of error of plus or minus 3.5 percent at the 95 percent confidence level.
We also want to point out that, throughout this report, some percentages do not total 100 percent, due to the effect of rounding and the fact that some respondents did not answer all of the survey questions.
Our survey sample showed the following, demographic characteristics:
Region: The sample included and we received responses from dentists located in all regions of the country. For purposes of this survey, the United States was divided into nine regions.
New England (Maine, New Hampshire, Vermont, Mass-achusetts, Rhode Island, Connecticut), 5 percent of respondents (identical to last year`s response).
Middle Atlantic (New York, New Jersey, Pennsylvania), 17 percent (same as last year).
East North Central (Ohio, Indiana, Illinois, Michigan, Wisconsin), 20 percent (up from 18 percent in our 1995 survey).
West North Central (Minnesota, Iowa, Missouri, North Dakota, South Dakota, Nebraska, Kansas), 9 percent (down from 10 percent the previous year).
South Atlantic (Delaware, Maryland, District of Columbia, Virginia, West Virginia, North Carolina, South Carolina, Georgia, Florida), 12 percent, (down from 16 percent in our 1995 survey).
East South Central (Kentucky, Tennessee, Alabama, Miss- issippi), 4 percent (down from 5 percent last year).
West South Central (Arkansas, Louisiana, Oklahoma, Texas), 8 percent (down from 9 percent the previous year).
Mountain (Montana, Idaho, Wyoming, Colorado, New Mexico, Arizona, Utah, Nevada), 6 percent (identical to last year`s results).
Pacific (Washington, Oregon, California, Alaska, Hawaii), 17 percent (up from 15 percent in our 1995 survey).
Gender: Some 7 percent of this year`s respondents were female, down from 8 percent participating in last year`s survey. Seventy-three percent of both men and women respondents reported they were in solo private practice. This represented a 9 percent increase from the percentage of women in solo practice who responded to last year`s survey. Another 6 percent of men and 2 percent of women said they were in a group practice, 8 percent of men and 13 percent of women were in a partnership and 5 percent of men and 11 percent of women checked the employee/contractor-associate category. And although 6 percent of our male respondents indicated they were part of a space-sharing solo arrangement, no females checked this category.
The women dentists` average fees were higher for 42 of the 46 services surveyed, compared to higher fees for 38 services in last year`s survey. The differences were minor for most services, amounting to $2-$5. But for some services, such as a one-surface metallic inlay and a complete lower denture, women`s average fees were $39 higher; for a full-cast, high-noble metal gold crown, their average fee was $38 higher; and for a complete upper denture, the difference was $36.
Male dentists` average fees were $10 higher for upper and lower denture relines, $1 higher for recementing crowns and $1 higher for introral periapicals (first film).
Practice Setting: Some 73 percent of the dentists in our survey were solo practitioners (up from 72 percent in our 1995 survey); 5 percent were space-sharing solos (down from 7 percent the previous year); 8 percent were in a partnership practice (down from 6 percent in last year`s survey); 5 percent were in a group practice with three or more dentists (identical to 1995 survey findings) and 5 percent were in the employee/contractor-associate category (down from 8 percent in our 1995 survey and 6 percent in the 1994 survey).
Years in Practice: Twenty percent of this year`s survey participants told us they have been in practice nine years or less, down from 24 percent the previous year; 52 percent have been in practice 10-24 years (the same as last year); 20 percent have been in practice 25-34 years (up from 18 percent in our 1995 survey); and 8 percent have been in practice 35 or more years (up from 6 percent the previous year).
Practice Locale: Twenty-eight percent of our respondents practice in an urban area, identical to 1995 figures; 50 percent practice in a suburban area, down slightly from 51 percent the previous year; and 21 percent have rural practices, the same as last year`s results.
Patient Visits: Seventy percent of our respondents reported they see between 31-75 patients weekly, up from 68 percent in our 1995 survey and 64 percent in our 1994 survey. Another 19 percent said they see 76-150 patients per week, identical to last year`s figures. The average hourly production rate for our respondents in this year`s survey was $205, down from $226 in our previous survey.
Third-Party Involvement
Respondents were asked to estimate the percentage of their patients having dental insurance or capitation benefits. Some 57 percent of those surveyed estimated that between 45 and 74 percent of their patients are covered by dental insurance or capitation plans. This was a significant 10 percent decrease from the 67 percent of respondents in this category in last year`s survey.
Twenty-three percent of survey participants said that 75 percent or more of their patients have dental benefits, up from 21 percent in our previous survey. Another 11 percent reported fewer than 45 percent of their patients are covered by a third-party plan, identical to 1995 survey results.
This year, Pacific Region dentists had the highest percentage of patients with dental-insurance or managed dental-care benefits. Over three-fourths (77 percent) of Pacific Regions dentists said 60-99 percent of their patients had some kind of dental benefits. That compares with a low of 40 percent of dentists in the West North Central Region who said the same percentage of their patients were covered.
Again this year, group practices had the highest rate of participation in some form of preferred-provider or exclusive-provider organization (52 percent), compared with 33 percent of solo practitioners (35 percent the previous year), 37 percent of partnerships (46 percent in our last survey), 42 percent of employee/contractor-associates (41 percent the previous year) and 38 percent of space-sharing solos (39 percent in our 1995 survey).
However, the participation rate of groups in capitation plans decreased significantly this year-from 34 percent participating in capitation operations in our 1995 fee survey to only 21 percent participating in such plans in this year`s survey. Capitation plan participation rates for the other forms of practice were: 10 percent for both solo and space-sharing solos; 13 percent for partnerships and 22 percent for employee/contractor-associates.
The percentage of urban dentists participating in PPOs or EPOs rose to 45 percent from 42 percent the previous year, while the percentage of suburban dentists in such plans declined from 40 percent in our 1995 survey to 35 percent in this year`s survey. Participation by rural dentists remained the same at 23 percent.
The percentage of female dentists participating in some form of managed care increased from 37 percent in our 1995 survey to 39 percent in this year`s survey. The participation rate by male dentists declined from 37 to 35 percent. Women dentists also had a higher rate of participation in capitation-type programs (23 percent vs. 10 percent of male respondents).
Fee Comparisons
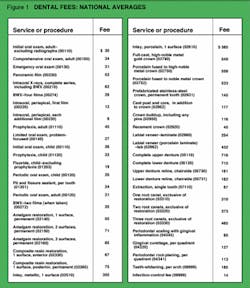
Figure 1 shows average fees for 46 procedures for 1995 and compares them with 1994 fees. However, there was a wide range between the highest and the lowest fee charged for each service. For example, the fee for an initial oral exam for an adult, not including radiographs, ranged from a high of $159 to a low of $10 (the range was $100 to $10 in 1994); for a one-surface amalgam, the fee ranged from a high of $140 to a low of $20 (the range was $125 to $15 in 1994).
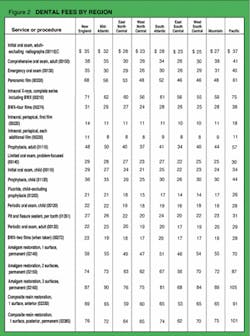
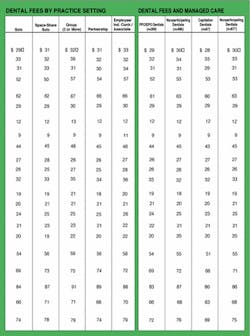
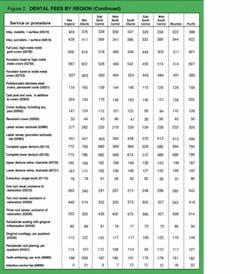
In Figure 2, we show 1995 regional fee averages, crosstab 1995 fees by practice setting and compare 1995 fees of strictly fee-for-service dentists with those who participate in some form of managed-care plan.
Again, this year, fees were highest in the Pacific Region and lowest in the East South Central Region. Pacific Region dentists had the highest average fees for 34 of the 46 procedures we surveyed, down from 38 last year. East South Central Region dentists had the lowest fees for 31 of these 46 services.
Looking at fees by practice setting, we noted group practices had higher, average fees on 18 of the 46 procedures, a drop from higher fees for 26 of the 46 procedures last year.
We also compared the fees of dentists in both preferred-provider plans and capitation plans to those who indicated they do not participate in any type of managed-care program. Dentists in preferred-provider or exclusive-provider organizations had higher, average fees for only seven of the 46 procedures, down from higher fees for 15 of the procedures in our 1995 survey and 24 of the 46 services in our 1994 survey.
Surveyed dentists who told us they do not participate in preferred-provider or exclusive-provider plans had higher fees for 33 of the 46 procedures, up from higher fees for 24 procedures the previous year. The two groups had the same average fees for six procedures, down from seven in the previous year`s survey.
Those in capitation plans had higher, average fees for only two services, a decrease from higher fees for 18 procedures in our 1995 survey and 24 services in our 1994 survey. Those dentists surveyed who do not participate in capitation plans had higher fees for 35 services, up dramatically from 23 services the previous year and 17 services the year before that. Average fees of capitation and noncapitation dentists were the same for nine services.
