CAD/CAM technology

by Charles Rodgers, DDS
A New Look at the Bottom Line!
I am involved with a dental service organization that is known for its facilitation of the use by dentists of CAD/CAM technology. I realized that we possess actual historical data that illustrates the direct impact of CAD/CAM use on lab and supply costs. My purpose here is to look at a side-by-side comparison of two very similar offices and how their different approaches to integrating CAD/CAM technology directly affected the bottom line of each office's profit and loss statement.
• Both offices opened around the same time.
- Office 1 opened September of 2002.
- Office 2 opened February 2001.
• Both offices had access to CAD/CAM around the same time.
- Office 1 had a CAD/CAM installed July 11, 2007.
- Office 2 had a CAD/CAM installed August 8, 2007.
• They are both owned by the same affiliated owner doctor.
• They are only 15 miles apart in Southern California.
• Both facilities were built new with roughly the same square footage and number of treatment rooms.
• They both function as a group general practice model with multiple associate doctors and limited specialty providers.
Even with all of these similarities, there was a huge difference in how, and over what time period, each office chose to integrate the CAD/CAM technology. This resulted in a dramatic difference in the utilization percentage of the CAD/CAM machine, which is clearly reflected in the financial statements for each office.
I personally have worked in both offices and have firsthand knowledge of the CEREC integration and resultant impact on the financials. While it would seem most desirable to evaluate the net operating income (NOI) at each location, that figure can be related to several extraneous variables. The best approach is to directly compare the lab and supply cost at each location. If an office is actually milling crowns in the office, there will be a reduction in lab costs. If an office is imaging instead of taking impressions, of course there is a related drop in consumables related to those impression materials. The lab and supply percent change will drop straight to the bottom line on the profit and loss statement.
Initially we considered CEREC, in many ways, similar to any other technology that we had evaluated for integration. We asked a lot of questions. What will be the total cost for setup and training? How much to maintain? Any retrofits to accommodate the technology? How much will it cost per unit? With all of those potential unknowns, the real big question that kept coming up was "What is the bare minimum number of units we need to perform to justify the technology cost?" In retrospect, it seems an odd question, but it was always the main question. Compare that to "What is the least I can do to get through this college course?" or "What is the minimum I can do to keep my job?"
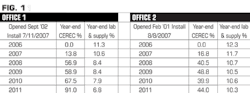
CEREC restorations are good for patients. CEREC has quickly become my preferred restoration because they allow clinicians to produce restorations in a single visit while providing the highest level of patient care. The approximate number of units needed per month would vary by estimator, but most agreed that somewhere between 20 and 30 units would be adequate to cover the expense. The majority of patient crown procedures are posterior, so highly intense esthetics would not typically be a major concern for most cases. In these two offices with multiple general practitioner providers, it seemed a fairly easy thing to accomplish. Each doctor could do one unit every second or third day and they would be in the right range. The problem with this approach: Each doctor was thinking the other doctors were doing more than enough, so they did not focus on it individually, and the machine was at risk of being underutilized. No dentist wants to purchase new technology and have it sit idle. We had the need to track the actual number of units of CAD/CAM being done compared to the total indirect units the office performed. This equation became our CEREC percentage. Figure 1 illustrates the historical CEREC percentage at these two office locations for the years 2006-2011, as well as the year-end lab and supply percentage for these two locations.
The challenge of learning the technology was not so difficult. The bigger challenge was consistently implementing it to the point where it became the new, most frequently used behavior. The first layer of training was for the dentists practicing in the offices. Highly qualified external trainers were chosen for this.
When it came time for actual in-office use, obstacles were present on many levels. As is often the case with dentists, we seem to always find a reason why we can't do something. There was a need to address the excuses.
I can't do CEREC on this tooth because the gums are bleeding too much.
How about using an astringent agent or a diode laser?
I can't fit the camera to get the second molars imaged.
How about an impression and image the model?
I can't get done before the patient has to leave today.
Use a temporary and have the patient come back tomorrow for cementation.
An important realization was that a large portion of the CEREC process is not clinical and more technology-based and could lie in the hands of the dental assistants. The secondary team layer to be trained was the chairside assistants. This helped to encourage use of CAD/CAM by the doctors as well, as they felt more confident in the team members that surrounded them. With the office already fairly adept with the use of the technology, the only weak spot would be any recent hires, whether assistants or doctors. The third layer of training involved any new hires.
While Office 1 methodically jumped through the steps of training, Office 2 was often hesitant and resistant. Office 2 would have short gains followed by a reverse. By the third year it was evident that Office 2 was stagnant with CAD/CAM use. This was quickly followed by in-office training as well as team training, all with little to no success. Clearly Office 2 needed to believe in the value of the technology, be comfortable with the technology, and be open to the full potential that lies within a complete technological integration. Without the clinical leadership at the office promoting the best use of CAD/CAM based technologies, the second office could only maintain its current position.
At the end of 2011, there was a 3.5 point difference in year-end lab and supply expense. That might not seem like such a big number, but for an office doing $100,000 a month in revenue, for example, it translates into $3,500 per month difference. Over the course of a year, that is $42,000 (Figure 2). In the specific case examples shown here, both offices average over $200,000 per month in revenue. That makes the difference between the two offices' lab and supply expenses a minimum of $84,000 for just the year 2011.
Additionally, at Office 1, there was a 4.5% drop from 2006 to 2011 for year-end lab and supply expense. Based on the minimum Office 1 revenue already mentioned, that is over $108,000 ($200,000 X 4.5% X 12 months) in improvement when comparing year 2011 to 2006 for Office 1. These are significant numbers that drop straight to the bottom line of a profit and loss statement. Office 2 had a 2% drop in lab and supply expense with only half as much utilization of the CEREC machine.
These dramatic changes are not tied to producing more, diagnosing more, or even growing the office bigger. In fact, in this example, the office that did grow more in gross revenue, as well as size, was the office with the poorer CEREC percentage results, Office 2. This was related to patient flow and not the office's CAD/CAM use. Ironically, this CEREC percentage often resulted in Office 1 having a higher NOI percentage and occasionally a higher true dollar NOI, even though it was the smaller office.
This side-by-side comparison of two offices' varying levels of CAD/CAM commitment and integration clearly illustrates the related direct financial impact. The CEREC utilization percentage exacts a cumulative financial impact over time as well. This is just a partial view of the integration of CAD/CAM in the two facilities; you must keep in mind there is much more complexity to any new technology integration.
Charles Rodgers, DDS, is a 1987 graduate of Loma Linda University School of Dentistry. He has been affiliated with Pacific Dental Services since 1994, becoming an owner doctor in 1996, a multi-owner doctor in 1998, and is now vice president of clinicians as well as Colorado-Utah PDS regional partner. He also oversees PDS clinical direction as chair for their National Dental Advisory Board. He is a member of the ADA, CDA, Orange County Dental Society, American Academy of Oral Systemic Health, and cerecdocs.com. He can be reached at [email protected].
Past DE Issues