The future of dentistry: Economic trends

The first two articles in this series explored trends in dental education and how they have impacted dental manpower trends. We saw how major shifts in dental school enrollments eventually translated into changes in the number and mix of dentists. Some of the major changes in manpower include: a decrease in the number of dentists by the end of this decade, an increased proportion of female dentists, part-time dentists, and specialty dentists, and finally, a dentist-to-population ratio that is currently decreasing and is projected to decrease at least until the year 2020. In this article, we will explore trends in economics.
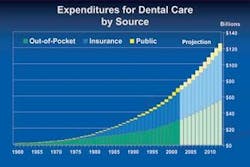
Expenditures for dental services increased from just less than $2 billion in 1960 to $70.3 billion in 2002 —a more than 35-fold increase (Figure 1). The U.S. Centers for Medicare and Medicaid Services (formerly the Health Care Financing Administration) have projected the level of expenditures to the year 2013. These projections show expenditures for dental services increasing annually to $126.3 billion by the end of the projection period. That’s an additional 80 percent increase in total expenditures for dental services and an average annual increase of 5.5 percent. The expenditure data were divided by the total U.S. population to arrive at expenditures per capita for dental services. Expenditures per capita for dental services increased from $10.86 in 1960 to $244.20 in 2002—a more than 20-fold increase, or an average annual increase of 7.7 percent. Expenditures per capita are projected to increase to $397.54 by 2013, or an average annual increase of 4.5 percent. Finally, expenditures per active dentist increased from $21,787 in 1960 to $490,566 in 2002; also a more than 20-fold increase, or an average annual increase of 7.7 percent. Expenditures per dentist should rise to $905,189 by 2013 - an average annual increase of 5.7 percent.
The mix of expenditures’ sources for dental services has also undergone major shifts (Figure 1). In 1960, out-of-pocket expenditures accounted for more than 97 percent of dental expenditures. Insurance as a source of dental expenditures increased rapidly through the 1970s, ’80s, and early ’90s, peaking at 52.3 percent of dental expenditures in 1996. Since then, insurance as a source of expenditures has decreased slowly. Government sources of dental expenditures were virtually nonexistent in 1960, accounting for less than 1 percent of all expenditures. Government expenditures have risen slowly since then. The profile of expenditures for dental services in 2002 was 49.6 percent from insurance, 43.9 percent from out-of-pocket, and 6.5 percent from government sources. In contrast, government sources accounted for 33.8 percent of expenditures for physician and clinical services in 2002. The U.S. Centers for Medicare and Medicaid Services predicts insurance, as a source of expenditures, will continue its slow decline to 47.9 percent in 2013. They also estimate out-of-pocket expenditures to essentially remain constant at about 44.2 percent of expenditures and for government sources to increase to 7.9 percent of all dental expenditures by 2013. This projection estimates government expenditures for dental services doubling by 2013 to approximately $10 billion. Historically, government expenditures for dental services have not increased at this rate.
Long-term economic trends are heavily influenced by changes in the inflation rate. By adjusting actual data (real dollars) using the Bureau of Labor Statistic’s Consumer Price Index, or CPI, one can compensate for inflationary effects and view these economic trends in constant dollars. Therefore, the income and expenditure data presented here are adjusted by the CPI to reflect constant dollars. In this way, we are better able to ascertain real rather than inflation-induced growth.
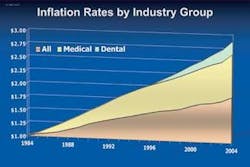
The cost of goods and services is influenced by inflationary factors. Figure 2 shows how inflation has affected the cost of all goods and services, medical services, and dental services during the past 20 years. This graph shows how much $1 worth of goods and services in 1984 would cost today. The cost of $1 worth of all goods and services has risen to $1.85, an increase in inflation of approximately 85 percent during the past 20 years. The cost of medical services has risen more quickly. One dollar’s worth of medical service in 1984 would cost about $2.65 today. The cost of dental services has risen even more. That dollar’s worth of dental services in 1984 would now cost $2.89. There are several reasons for the increased cost of dental services, including increased requirements for infection control protocols and increasing staffing levels. We will investigate the staffing level issue in more detail in the final installment of this series.
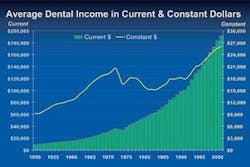
Dental incomes generally follow the trend in dental expenditures. In 1952, the average total net income for all dentists was $10,539, according to data compiled by the American Dental Association, (ADA). By 2001, the average net income had increased to $191,690 - a more than 18-fold increase (Figure 3). As in the expenditure data, these income figures are influenced by inflationary trends. To see whether dentists’ incomes have really improved, the income data were adjusted by the CPI. Real dental incomes (in 1950 dollars) have not always increased. Between 1972 and 1983, the average real income per dentist fell by 26.3 percent. However, the average real income per dentist increased by 21.8 percent during the next decade (1982 to 1991), and from 1992 to 2001, the real average income increased by 46.2 percent. The average age of the dental workforce has a significant impact on the recent rise in dental incomes. In 2002, almost one-third (32.2 percent) of all active private practitioners were between 45 and 54 years old - traditionally a dentist’s most productive period - according to ADA data.
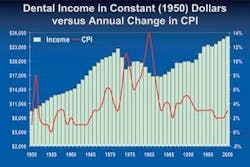
Periods of high inflation can have a negative impact on dental incomes. The annual percentage change in the CPI is compared to real dental incomes in Figure 4. As dental incomes fell between 1973 and 1983, the CPI increased 124 percent (an average inflation rate of 8.2 percent per year). As incomes rose steeply from 1992 to 2001, the average annual increase in inflation was only 2.7 percent. During periods of double-digit inflation, dentists are generally not able to increase their fees to keep pace with inflationary pressures; consequently, real incomes tend to fall during these times.
The trend data on dental expenditures are important because they form the economic foundation for the profession. These data show that spending for dental health care has increased both overall and per person. In addition, the trend is expected to continue for at least the next decade. The projected increase in real dental expenditures also means an increase in expenditures per dentist as well. If the forecast is accurate, real expenditures per dentist should increase by an average of 5.7 percent per year during the next decade. Barring a cycle of high inflation, dentists can expect their gross incomes to increase during the next decade as well.
The pieces are beginning to fit together. We have a sound economic forecast to add to the significant changes in dental manpower that were discussed in the previous article. These trends will undoubtedly have an impact on the practice of dentistry. In the final article in this series we will explore dental-practice trends and see how all these factors might change the dental practice of the future.